S&P 500 Potential Day Trade Setup Short – Market Manipulation
I wanted to throw a quick blog post together for those of you who trade equities as well. As you can see in the chart below a nice stop run reversal day trade setup has started to come together. The previous daily highs from early September, were until the last few days, the all time highs. Additionally this area is right around the big psychological barrier round number, 2000. So what does today’s potential stop run of the highs mean. Simply put it gives us a good indication of the next short term trend direction. When I say short term I mean a week to possibly a few weeks as that is “short” for the daily chart. Beyond that time it doesn’t tell us much. Does that mean it couldn’t continue for longer….no it obviously could. I’m simply referring to the likely length of these type of stop runs.
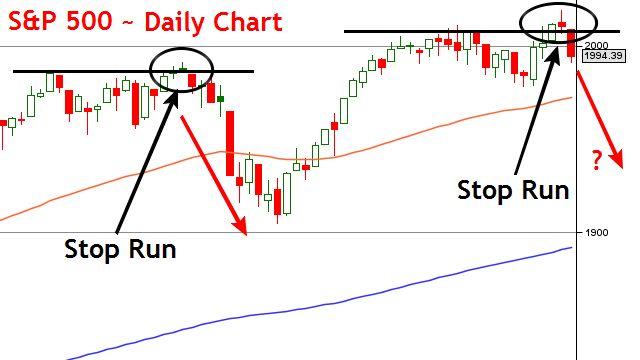
How would I look to trade this? As everyone knows I typically look for day trade setups off of the 15M chart. The same is true with the information above. The larger stop run gives us a solid indication of direction the following day and therefore I would be selling into rallies at that point where I’m comfortable putting my stop above the stop run highs. Another words until the stop is small enough to put above the stop run highs I simply won’t enter. Many who trade larger stop runs enter at percentage pullbacks. An example would be placing half the entry at 50% and the other half at 61.8%. I’m not personally a big fan of this trade entry technique as it ensures you have a full position on every loss, while some winning trades you may only carry a half position. I prefer to enter when/if a stop run sets up off of a smaller intra-day level. Maybe the market comes up tomorrow and creates a stop run of the 2000 level on a 15M chart. This would be the type of entry I would prefer. Because you have the support of the daily chart setup it would be worth holding for longer than a tradition day trade setup we might otherwise take.
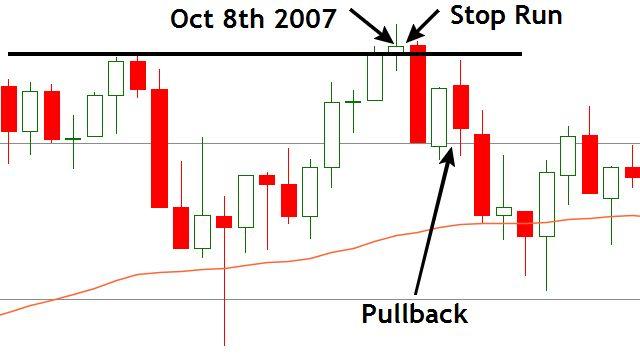
Just as some food for thought in regards the power of tracking and trading market manipulation….below is a weekly chart of the S&P going back to the crash in 2007-08. Its not a coincidence that these false breaks/stop runs/manipulation moves precede most “major moves” on any time scale. If your looking at the 15M chart then the “major move” will be that days trend. If your looking at an hourly chart then the “major move” might be a 2-3 day swing trade. If your looking at a daily or weekly chart then the “major move” may last weeks or months. So when you I say major move I’m talking in relative terms in relation to the time frame chart you are trading from.
Regardless of what you trade (equities, commodities, ETF’s, forex, ect), you can learn to trade & track market manipulation. For more information check out our Day Trader Training Course
-Sterling