Introduction to Fundamental Analysis
As already described in earlier chapters, forex analysis using fundamental analysis is studying the underlying economic, social and political themes governing each currency pair in focus. These underlying factors help track the supply and demand forces that drive market flow. In other words, you could say the fundamental analysis is the measure of currencies using the strength and weakness of the economic outlook of the countries they represent.
To carry out fundamental analysis in the proper way you need to be aware of certain macroeconomic indicators that serve as a catalyst that causes traders to aggressively place orders in or against the direction of the current market bias. This bias more often than not is also caused by the on-going fundamental theme, which has been or continues to be priced into the market.
In an effort to further clarify the difference between fundamental themes and indicator catalysts let’s use an example. A theme is an economic event that has an overwhelming effect on the economy, which could last from a few months to a few years. Example of these themes include Brexit, Donald Trump becoming president and the United States Federal Reserve Quantitative Easing Program, etc.
The indicator catalysts, on the other hand, are the macroeconomic data that are released weekly and monthly, which confirm, exacerbate or diminish the effects of core themes on the economy. Examples of these indicators are interest rates, inflation rate, gross domestic product, etc.
Let’s look at a scenario where both the core theme and the catalyst work together to create a view of the economic outlook, which in turn leads to market participants picking a bias in the market.
Brexit, as we know, is the United Kingdom’s decision to exit the European Union through a referendum. The risk to this is that the UK will have to renegotiate all their trade deals independent of the EU as exiting the EU will mean exiting the European Customs Union, which will also restrict movement of both citizens and goods between the UK and the EU. Economists have estimated that around 240,000 businesses will be subject to customs restriction, leading to delays in supply, especially food supplies. The UK also has the risk of 13 billion pounds in administration fees, which will be incurred due to the exit. As a result of these risks, the UK has to control how they exit the EU; their aim is to ensure they have a favorable deal in place to help mitigate or completely eliminate these risks above.
This dilemma explained above represents a core macroeconomic theme. To track how the process is unfolding, we then use the indicator catalysts. In which case, we pay attention to the scheduled events that affect the deal to be made, which in this case are the votes that are held by the UK parliament. When we get a result that is likely to offset the risk, we see the pound gain aggressively against most pairs, and when we get results that are likely to exacerbate or confirm the risk, we see the pound weaken against most pairs.
Since we place our trades based on our interpretation of the fundamental indicator catalysts, it is important to understand the several macroeconomic indicators that exist and how they affect markets across the board.
The macroeconomic indicators are the main focus for traders who choose fundamental analysis; they are published regularly by governmental agencies and private sector firms. Let’s discuss these indicators.
Macroeconomic Indicators
Interest Rates
This is likely to be the most important of all the economic indicators as it can signal the flow of demand and supply of a currency pair. An interest rate represents a nation’s level of reward for its debt. You notice most nations with stabler economies have a lower interest rate than countries with less stability in their economies. The idea is if the risk of lending money to a country is high they have to offset that risk with a higher reward.
Changes in interest rates are done only by the central banks for an array of reasons, the most important being to curb an excess supply of money in the nation, thereby halting inflationary conditions in the economy. If the interest rate is increased, it implies that money will become more expensive as banks will lend to businesses at higher rates, given less incentive for expansion or increased wages. While increased interest rates curbs spending, it also increases savings as interest rates on savings and cash deposit accounts go up. This in total causes less local currency to be spent on acquiring foreign currencies. By definition, an increase in interest rates should lead to an increase in the currency value of a nation and vice versa.
Monetary Policy
Central banks mostly use the interest rates to influence economic outlook, but in the case where interest rates are at zero bounds they need more tools, which come in the form of policies that aim to control both inflation and money supply to ensure stability in the prices of goods and services; this, in turn, creates stability in the currency of the nation in question.
An example of a monetary policy that does not involve just adjusting the interest rates is the United States Federal Reserve Quantitative Easing Program, popularly known as QE 1, 2 and 3. This involved the FED embarking on a systemic large-scale purchase of financial assets across the United States where the objective was to inject money into the system. This served the same accommodative purpose as a cut in interest rates would have driven the USD down amidst every monthly injection of money into the economy.
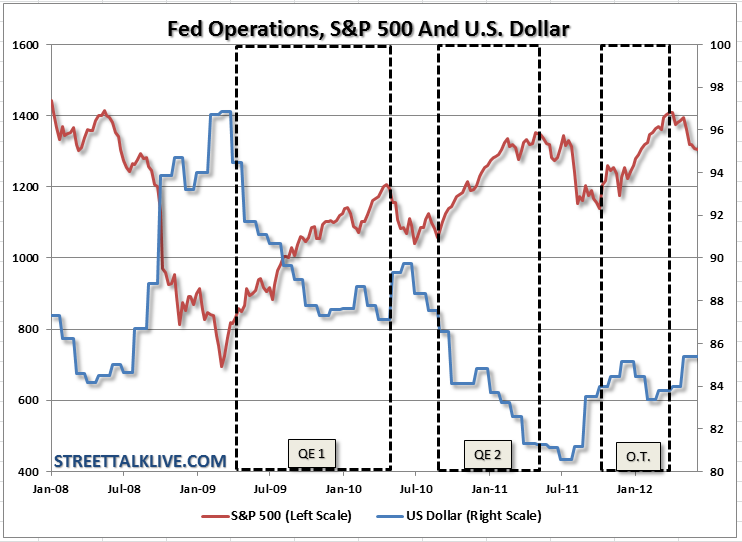
As you can see from the picture above, the USD declines during the period of the QE programs while equities do significantly well. This comes from the scenario we discussed earlier. When money is cheap and easily accessible, companies have more incentive to borrow as the banks lend at low rates. This creates more investments leading to higher returns for equities while lower interest rates sustained by cheap money also cause a reduction in foreign investment, creating a decline in demand for the domestic currency, dragging the dollar down further.
Basically, cheap money sustains low rates, which in turn weaken a nation’s currency.
GDP (Gross Domestic Product)
This is one of the primary indicators used in gauging the overall health of an economy. The GDP is a measure of the final goods and services produced in an economy within a specific time period. You can also refer to GDP as the value added or the total income added to the economy within a given time frame.
Given that the GDP deals with only final goods and services, this means it ignores intermediate goods: these are goods that are used in the manufacture of other goods and the final goods are those that are produced directly for end users.
GDP is made up of a few components that sum up the entire value added to the economy. These components are listed below:
- Consumption
- Investment
- Government Spending
- Net Exports
Any change in these components affects the overall GDP and should be watched closely if one intends to trade the fundamental analysis.
The entire aim of traders tracking the GDP numbers is mainly to follow the growth rate as consistent growth in the GDP means there is a positive pull on the strength of the economy, which leads to strength in the currency as well. A decline in the GDP growth rate usually leads to a weakness in its currency.
INFLATION RATE
Inflation, generally measured by the consumer price index (CPI), is a measure of the rate of change in the level of retail pricing of a select basic consumer basket. The idea is if the price of this consumer basket is increasing, general inflation will be rising as well.
When prices of goods and services increase, the currency weakens as its purchasing power is diminished. This means the same amount of set currency can now purchase fewer goods than it used to. Price increases can have adverse effects on the general public as the disposable income of individual households will have their purchasing power weakened. This, in turn, could stifle the economic growth of the nation.
Inflation can also have a positive impact as rising prices in some cases could enhance returns. Take investments in tangible assets like properties and commodities where the price increase is directly correlated to higher returns on investment.
Factoring in the above condition, inflation can have both positive and negative impacts on the economy. The job is left to the authorities to use the tools within their power to keep inflation at optimum levels that balance its impact on the economy. Generally, most economists suggest that sustained inflation is as a result of money supply outpacing economic growth. Therefore, by controlling the money supply you control inflation. Setting inflation is a leading indicator because its movements have a bearing on what decision central banks will take in terms of monetary policy to control the money supply.
Basically, during normal economic conditions, an increase in inflation is likely to lead to increased money supply, which would drive authorities to raise interest rates, causing the currency to increase in value.
It’s important to note that in other economic conditions, like when interest rates are at zero bounds and you have to use mediums like QE to stimulate the economy, a rise in inflation might have other outcomes in terms of the currency of the nation. So it’s better to see inflationary impacts on currency through the eyes of the overall economic outlook.
UNEMPLOYMENT
This is another very important macroeconomic indicator as it also measures the overall health of the economy. The production and consumption levels are highly reliant on the number of jobs created vs. the amount of the population on welfare benefits.
The Non-Farm Payrolls (NFP) can be said to be the most popular catalyst indicator in the forex market. It is an aggregate of the total number of jobs created in the United States of America and it is released once every month, usually the first Friday of every month. A rise in the numbers would strengthen the USD aggressively while a lower than expected number would weaken the USD. This is a similar case with all other currencies as a change in unemployment numbers would have an aggressive impact on their currency price.
PRODUCTION AND TRADE
Trade balance, production and manufacturing index are important economic measures for production and demand within an economy. There is an array of indicators used to measure these aspects of the economy, they are discussed below:
Purchasing Managers’ Index (PMI)
This is derived from a survey done on purchasing managers measuring the level of a diffusion index. It is done by surveys completed by executives in over 400 companies; they cover five major areas, which are production, inventory levels, new orders, supplies, and employment.
The PMI is calibrated from 0 to 100; a release over 50 usually confirms expansion in production, which is positive for the economy, while below 50 is a contraction in production. A flat 50 represents no change in production. These readings are usually measured against previous months and forecasted figures as a figure that comes in higher than the forecasted while being higher than 50 increases the positive impact on the currency and vice versa.
Producer Price Index (PPI)
This measures the change in the price of finished goods and services sold directly by producers. It is released in percentages, which shows the change month on month. It is also referred to as Industrial Producer prices. An increase in the percentage change favors the underlying currency and a decrease weakens the currency.
Industrial Production
This is a comprehensive measure of the output in the industrial sector of a country. In the United States, this report is released by the Federal Reserve and it covers mining, manufacturing, gas and electric bills. It is also released in percentages, where an increase from previous and forecasted would be positive for the underlying currency and a decrease would weaken the currency.
Trade Balance
The measures the difference between the worth of a nation’s imports and its exports of goods and services reported monthly. When the exports exceed the imports, the nation is said to have a positive trade balance or a trade surplus. This is positive for the nation’s currency as it means there is more foreign currency exchanged for its local one in other to purchase local goods abroad. On the other hand, a trade deficit or negative trade balance occurs when the imports exceed exports; this scenario weakens the nation’s currency as more local currency is exchanged for foreign currencies to purchase foreign goods and services.
ISM Non-manufacturing
This is also a measure of the total output of a nation but specifically from non-manufacturing firms. ISM represents the “Institute of Supply Management” who conduct the survey from over 400 non-manufacturing company leaders that measure supplies, inventories, prices, new orders, and employment trends within non-manufacturing companies.
It is also calibrated from 0 to 100, where over 50 indicates expansion and below 50 indicates contraction. Although traders focus more on the forecasted figures, higher than expected figures would aggressively move the currency upward while a lower than expected figure would trigger aggressive selling on the currency.
Consumer Confidence
This is a really important sentiment-based indicator as it measures the consumer’s optimism or pessimism about the future outlook on the economy; it aims to track consumers’ willingness to purchase items and their propensity to save instead. As most economies/production is highly dependent on consumption, this tends to be a good indication of the overall health of the economy.
This is calibrated in single digits, where above 0 signifies optimism and below 0 indicates pessimism. The currency reaction to this release is also dependent on forecasted numbers as a positive reaction is subject to a better than expected number and a negative reaction is subject to a worse than expected number.
Factory Orders
This measure the rate of change in the value of new orders placed with manufacturers within a nation. It is also a good measure for demand and growth in consumer spending habits, it indicates that factories would increase production in an effort to fill the increased orders, which could lead to more jobs being created or increased wages. In other words, an increase in factory orders is positive for the underlying economy leading to a bias of LONG side trades on the currency and vice versa.
RETAIL SALES
This is one of the best measures of consumer spending patterns when dealing with finished goods as it measures the purchases from durable goods and non-durable goods. Higher sales in this category usually mean higher earnings, which helps share prices rocket. There are usually higher retail sales numbers during the holiday seasons, especially during the last quarter of the year as a result of events such as Black Friday.
The most important objective of this number is to gauge the level of disposable income spent directly from consumers, which in turn shows the overall view of the economy.
It is also gauged in percentages and, like most indicators calibrated in the same way, an increase in previous and forecasted numbers is positive for the underlying currency and a decline from the previous and forecasted would be negative for the underlying currency against other currencies.
CORE DURABLE GOODS ORDERS
This is a survey carried out by the United States Census Bureau, which measures the change in the new orders of goods that last for three years or more with the exception of transportation items; an example of this would be appliances such as fringes and smart televisions. It is released monthly and is another really good measure of demand and consumer spending. It also provides a good indication for the direction of manufacture’s future production outlook.
It is calibrated in percentages, so an increase from previous and expected would be positive for the currency while a release that is lower than expected would be negative for the currency.
Macroeconomic Indicator Hierarchy
We might have covered all the extremely important macroeconomic indicators, but all indicators are not made equal in the eyes of market volatility. As we discussed earlier, these indicators serve as a catalyst for price movement, some have greater impacts than others. You can distinguish between these indicators using most news calendars, a few are listed below:
- https://www.forexfactory.com/calendar.php
- https://www.forexlive.com/EconomicCalendar
- https://www.fasteconomicnews.com/fx_calendar.aspx
- https://tradingeconomics.com/calendar
For the sake of keeping records, let’s have a table of our own. Below is a list of indicators that are placed in a hierarchy of HIGH, MEDIUM and LOW impact. If you choose to be a fundamental strategy trader, the indicators identified as HIGH impact should serve as a catalyst for your fundamental bias/theme. In the case of the technical strategy trader, you want to avoid all taking or staying in trades during the HIGH impact news releases as they are very likely to increase the volatility of the market, which in turn would lead to you getting stopped out of your trade in a loss.
table 6
IMPACT | |||
MACROECONOMIC INDICATOR | HIGH | MEDIUM | LOW |
Retail Sales | * | ||
Manufacturing PMI | * | ||
ISM Manufacturing PMI | * | ||
GDP | * | ||
Interest Rate Decisions | * | ||
Service PMI | * | ||
Building Approvals (AUD) | * | ||
Final Service PMI | * | ||
Central Bank Governor Speech | * | ||
Trade Balance | * | ||
Household Spending | * | ||
Non-Farm Payrolls | * | ||
Unemployment Rate | * | ||
Consumer Price Index (CPI) | * | ||
Producer Price Index | * | ||
Core Durable Goods | * | ||
Manufacturing Sales | * | ||
FOMC Press Conference | * | ||
Libor Rate | * | ||
Philly Fed Manufacturing Index | * |
The focus here should be solely on the high-level impact indicators as they can be vital to the volatility of your current market trading conditions.

