Introduction to Risk Management
The importance of risk management cannot be overemphasized as you can safely say it is the most important aspect of retail trading, especially in the forex market. Ironically, it is also the most overlooked aspect of forex trading; it is funny how most beginner traders ignore the most important aspect of trading simply because it seems like a simplistic idea and everything else seems more complex. I guess this comes from the basic human nature that wants to take on the difficult task first.
You will come to realize that, while the ideas needed to implement a successful risk managing strategy may seem simple at first, there is nothing simplistic about staying disciplined and controlling your greed or appetite to trade away from your set rules.
Understanding your risk within your strategy and its relationship with the risks within the current market environment will help you identify how to navigate through different scenarios in the market.
Most traders desire to lose little or nothing when they come into trading but aim for ridiculous upsides. The truth of the matter is there is no reward without risk in this game; what you should want is to figure out how best to minimize risk and maximize profits. Proper risk management will help you achieve this goal.
RISK IN FOREX TRADING
The risk in retail forex trading is simply the total potential loss a trader is likely to incur from participating in the market. This can be measured in an array of ways, from a single trade loss to losing an account to the point of getting a margin call.
A massive fallout like blowing out a whole account is an all too familiar story for most traders at the beginning of their journey. I would reiterate, this is mostly due to bad risk-management habits but it can also be caused by a not so firm grasp on your preferred strategy. So it is also risky to jump into live trading with a strategy when you don’t fully understand its strengths and weaknesses.
All strategies are different and all come with their unique risk potential; it is therefore paramount that a trader has a deep understanding of the different aspects of a set strategy. I suggest treating each strategy you intend to learn like you would a person you are currently dating and you have high hopes for the relationship to grow into something serious. Get to know your strategy by demo-trading it correctly for over 100 trades, this will give you a fair sample size to measure potential risks the strategy may incur over time.
Good Risk Management Habits
Risk a Maximum of 2% per trade
This is a basic pro retail trading standard, exposing a maximum of 2% per trade. The idea here is to give your account the maximum chance to weather any storm that may come in the form a drawdown. This is a scenario where you have a series of consecutive losses, which is inevitable as a trader in the forex market. At a 2% loss per trade, it would take 50 consecutive losing trades to wipe out an account—think about that for a minute, 50 losses! If you do get 50 losses in a row it will have to be a record or you are completely not following any trade rules and you have the worst luck on Earth. I actually suggest starting at a percentage lower than 2% if it is your first time in the market and your account size/type allows you the possibility to.
Managing each individual trade in percentages of your total size gives you a perspective that follows through across any account size. If you have a 500 USD account, you know to risk only 10 USD per trade; no matter the pip amount on your stop-loss, you have to pick a lot size that allows you to risk 10 USD. This is why it is paramount that you demo trade your strategy until you have a firm grasp of how to select a lot size that keeps your risk stable over time.
Now, if your account finally grows to 1000 USD and a friend gives you another 4000 USD and now you have a total of 5000 USD, you already know what size to trade because as far as you know the focus is on percentages; as a result, there is less pressure derived from the larger account size.
Limiting Losses
There is a popular saying in trading that goes like this: “Cut your losses short and let your profits run.” The fundamental idea behind this is you have to make sure to use stop-losses. Whether it be static or dynamic, you have to know exactly where you want to get out of a trade before you get in.
A static stop-loss is when you have a fixed number of pips set as a stop-loss for all trades regardless of the market condition, while a dynamic stop-loss is based on price action or indicators. An example of using price action is when you set a stop-loss below a previous high or low. For indicators, an example would be using a moving average crossover as a stop-loss point. Some traders use time stops as well, which suggests that the price should be in their desired direction before the time elapses or they exit the position.
The fundamental idea here is that as a trader you should be fallible, you can’t afford to assume your analysis or strategy will always be right at any point in time. Therefore, the ability to accept when we are wrong is a vital skill to have in this field and placing a stop-loss directly means, “My analysis was wrong, therefore I am exiting this trade NOW.”
Risk vs. Reward
Here comes the most debated aspect of money management in the forex world. It all boils down to total accuracy over individual profits; this means there is some correlation between how much reward you make from each trade and how many times you get that reward over the times you lose.
To break this idea down into clearer terms, let’s use actual trade scenarios. If trader A risks $10 with a target gain of $20, which would be a 2:1 reward to risk ratio, and trader B risks $10 to gain just another $10, which is a 1:1 reward to risk ratio, assming they both are trading the same strategy and they are both profitable, trader B is most likely to hit more targets than trader A; but for each individual win, trader A is going to make twice what trader B makes in each trade. This brings us back to the debate of accuracy over reward.
Let’s try to resolve this debate with another possible trade outcome. The table below shows the trade results of trader A and trader B on 10 consecutive trades. Trader A, as you can see, makes five of his total trades and loses five, giving him or her a 50% accuracy, and trader B makes seven and loses three of his 10 trades, making a 70% accuracy; but as you can see from the net profits, trader A came out on top with a higher net profit than trader B despite the lower accuracy. This suggests that trading with a higher reward expectation will exponentially yield higher returns in the end.
This is why it just might be better to use strategies that provide a potential of more reward to risk in every single trade as it provides a statistical edge over trading with the intention of winning most of your trades.
TABLE 7
Trader A | Trader B | ||
-10 | -10 | ||
-10 | -10 | ||
-10 | -10 | ||
-10 | 10 | ||
-10 | 10 | ||
20 | 10 | ||
20 | 10 | ||
20 | 10 | ||
20 | 10 | ||
20 | 10 | ||
Net Profit | 50 | 40 |
Correlation
This is another very important aspect of trading to consider in order to manage risk properly as most currency pairs are correlated in one form or another.
A correlation between two currency pairs is the measure with which one currency moves in tandem with another. The idea here is derived from the fact that common factors affect multiple currencies at the same time as a result of things like trade, foreign direct investment, and consumption. For this reason, you will find some currency pairs moving parallel to each other, while some move directly opposite to each other.
Correlations are from -1 to +1 coefficient, where -1 is a complete negative correlation, where one currency pair moves directly opposite to the other; that means if one moves 10 pips in the upside the other would move 10 pips in the opposite direction. This is an ideal situation that is not likely. The negatively correlated pairs have a correlation coefficient between 0 and -1.
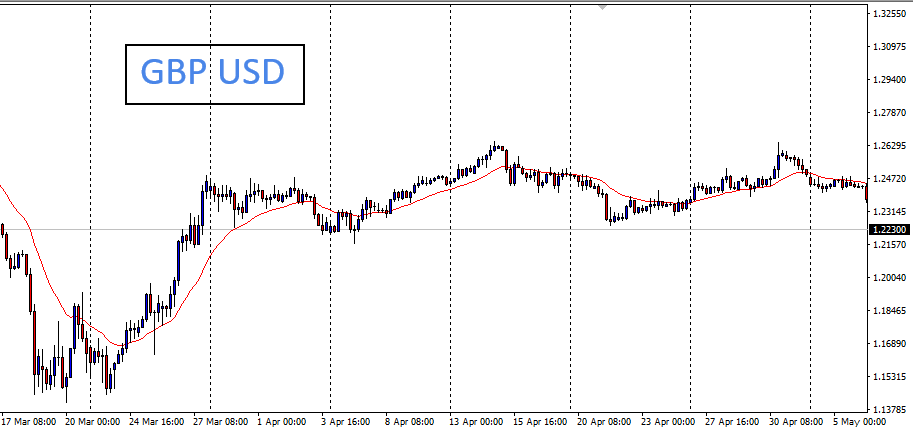
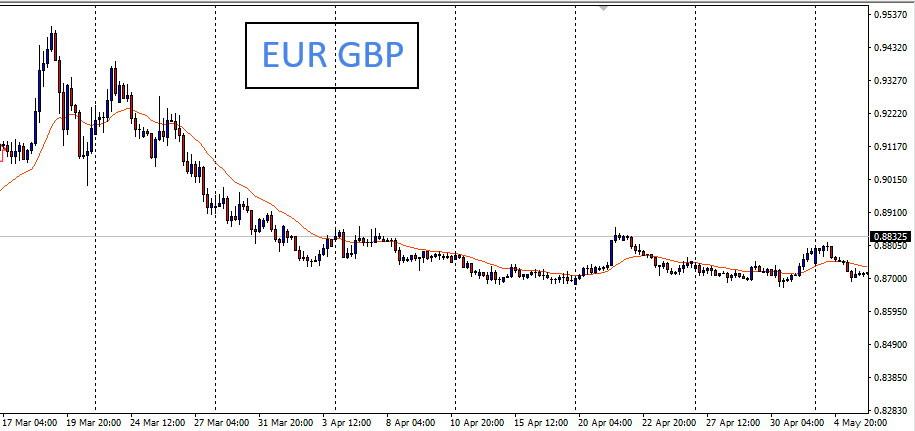
The above is a real chart example of negatively correlated pairs; in this case, it’s the EUR/GBP and the GBP/USD. You can see at areas where the GBP/USD moves downwards and the EUR/GBP moves upwards; it is almost like they are moving away from each other. This negative correlation mostly occurs where one currency in a pair is the base currency while in the other pair the same currency becomes the quote currency, as in the example above. The idea is if buyers are aggressive on a base currency of a particular pair, most likely they will be aggressive on other pairs containing that currency as well. So in a pair where that currency is the quote currency, a buy pressure for that currency would be derived by aggressive selling of the pair because traders are selling the base to buy the quote.
In the case of positively correlated pairs, a move in one direction for a pair would usually lead to a corresponding move in the correlated pair or pairs. An example of these pairs would be the EUR/USD and the GBP/USD. This correlation is from 0 to +1 where +1 represents an ideal positive correlation; this is where 1 pair moves up by 10 pips and the second pair also moves up by the exact 10 pips around the same time. As mentioned earlier, it is very unlikely to have a +1 correlation between pairs in the forex market.
Based on the concepts described above, the pairs that have their correlation coefficient closer to 1 or -1 are the pairs that are highly correlated.
CORRELATION COEFFICIENTS OF MAJOR PAIRS ON A YEARLY BASIS
table 8
EUR/USD | USD/JPY | USD/CHF | GBP/USD | USD/CAD | AUD/USD | NZD/USD | EUR/JPY | EUR/GBP | |
EUR/USD | 1 | -0.69 | -0.98 | 0.88 | -0.93 | 0.95 | 0.96 | 0.66 | 0.02 |
USD/JPY | -0.69 | 1 | 0.74 | -0.51 | 0.67 | -0.69 | -0.63 | 0.09 | -0.2 |
USD/CHF | -0.98 | 0.74 | 1 | -0.87 | 0.96 | -0.98 | -0.98 | -0.58 | -0.01 |
GBP/USD | 0.88 | -0.51 | -0.87 | 1 | -0.89 | 0.87 | 0.86 | 0.69 | -0.45 |
USD/CAD | -0.93 | 0.67 | 0.96 | -0.89 | 1 | -0.97 | -0.96 | -0.59 | 0.13 |
AUD/USD | 0.95 | -0.69 | -0.98 | 0.87 | -0.97 | 1 | 0.99 | 0.59 | -0.03 |
NZD/USD | 0.96 | -0.69 | -0.98 | 0.86 | -0.96 | 0.99 | 1 | 0.61 | 0 |
EUR/JPY | 0.66 | 0.09 | -0.58 | 0.69 | -0.59 | 0.59 | 0.61 | 1 | -0.2 |
EUR/GBP | 0.02 | -0.02 | -0.01 | -0.45 | 0.13 | 0 | 0 | -0.2 | 1 |
Paying good attention to these currency pair correlations is vital to avoid overexposure in placing positions. Let’s say you have accepted to only risk 2% per trade and you have two possible trades setting up on EUR/USD and the USD/CHF, both at about the same time and both in opposite directions. If you trigger them both for a risk of 2% each, you are essentially entering a 4% risk per trade. This is because these pairs are negatively correlated with a coefficient of -0.98, which is as close as you can get to a perfect negative correlation. Basically, both trades are very likely to move in profit together or produce a loss together; therefore, it is profitable to avoid taking more than one trade in highly correlated pairs to protect yourself from exceeding your risk limits.
In some cases, where your strategy allows only one trade at a time, you can focus only on highly correlated pairs to simplify your analysis as most of the time the price movements will be similar and when you don’t get your setup to form completely in one it likely will in another. In this case, you treat the pairs you focus on like a food menu where you pick the most palatable trade when it presents itself.

