Day Trading Forex Live – Advanced Forex Bank Trading Strategies

Basics of Manipulation Point Selection

August 30
14:36 2021

One of the core aspects of our strategy here at Day Trading Forex Live is level selection. These levels are areas in the market where we anticipate Smart Money to create a short-term manipulation of prices.

Price manipulation is a series of actions carried out by smart money to induce either buying or selling activity from other traders.

Why would they do that?

Smart money uses position sizes that stop them from simply hitting buy or sell as you and I would do. Because their position sizes are so massive they must enter over a period of time so as to not spike the price and reveal the position they’re entering.

Because of this they have to seek out areas in the market where liquidity is plentiful. These are the areas we term as manipulation points, and they are at the heart of the bank trading strategy. Let’s get down to business and start breaking down what they are in more detail as well as how you can profit from them!

• Manipulation points as support and resistance

As we know by now, support and resistance areas in the market are created by more aggressive buyers stepping into the market and driving prices higher or more aggressive sellers stepping in to drive prices lower. By this logic, it’s clear to see that a great deal of orders reside around key support and resistance zones.

We assume that the larger the level, the larger the orders/volume in that area. This condition is why we tag some of these areas as our manipulation points, as nothing condenses liquidity into a specific area like previous support/resistance.

There are few ways with which we select manipulation points. Some are simple and as easy as support and resistance that anyone can see. But, at the same time, others are a little more complex, as they involve underlining risk management decisions. This article breaks down the selection process as they go from simple to the most complex.

• The standard rule for valid manipulation points

Before we go into the details of selecting levels, let’s cover the most basic requirements.

RULE:

  • The price must move away from the level by 30% of the average daily range for that level to be considered a valid manipulation point.
  • For Intraday levels (which form within a single-day trading session), the price must move away from the level by 40% of the pair average daily range to be valid.

Standard Manipulation Point Selection

This standard selection is the most basic and easiest method of spotting manipulation points. Here we pick only the daily highs and lows or session highs and lows.

I recommend starting from the hourly timeframe to select these levels, plot them out on your chart before going through the ‘process of elimination’ we will discuss in other selection methods.

The daily highs and lows are among the most respected levels in price action analysis. You want to be thinking of these points as short term swing levels in the market. As they stand out, traders tend to focus on them as points of interest or stop loss locations.

Take a look at the chart below:

Selecting Manipulation Points in a Trend

In this case, we have first to discuss how we spot trends in a nutshell. Simply put, smart money tends to move price in three waves, which we refer to as the 1st, 2nd, and 3rd push. 

A valid push is when the market makes a single directional move of at least 90% of the average daily range. This condition invariable means when price does not make a 90% of the ADR move up or down, we consider that a sideways price action day.

Real World Application: For the first push, I’m quite strict with the 90% of the ADR rule. For subsequent pushes, if everything else is solid I might allow something as small as 80% of the ADR. 

• Details of trend selection

After getting a valid 1st push in any direction we only select manipulation points between the 25% and 65% retracement of the prior day’s push.

You can manually draw this level but I simply use a standard Fibonacci retracement tool with the 25% & 65% level as a replacement to the standard Fib levels. From there you would draw the retracement from high to low in a downward cycle and from low to high in an upward cycle. The chart below illustrates this idea in a downward cycle.

It’s important to understand that there is nothing magical about this retracement range of the prior days push. Simply put, markets don’t tend to move in a straight line so we expect some retracement. On the flip side you have to set a max retracement. Again, there is no perfect cut off for either but this has proved to be a very repeatable range for well over a decade.

This range also keeps your actions consistent as it defines the area where you can even select a manipulation point when a valid smart money cycle is present.

Selecting the Best Level to Trade

Picking the right manipulation point can present a problem when you have a cluster of levels. In these situations, the first level to be hit is often a false setup as the price often continues to the deeper level.

Take a look at the picture below…

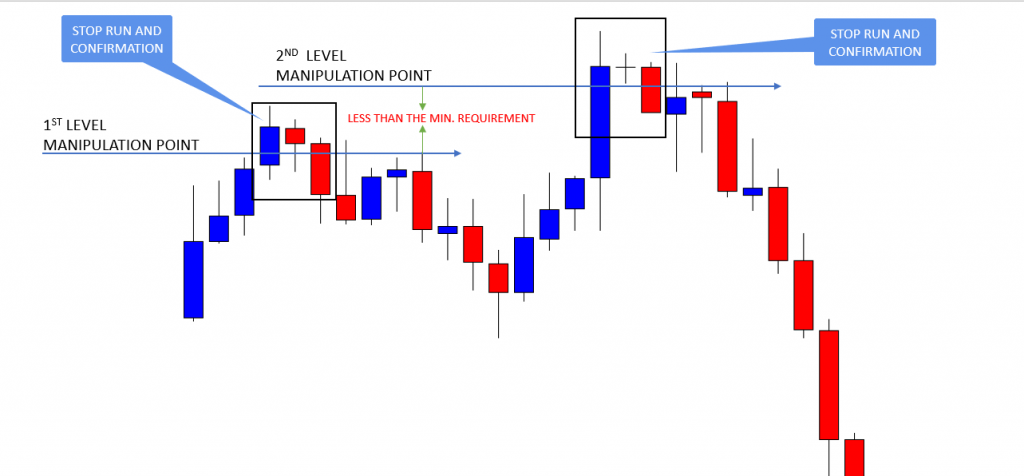
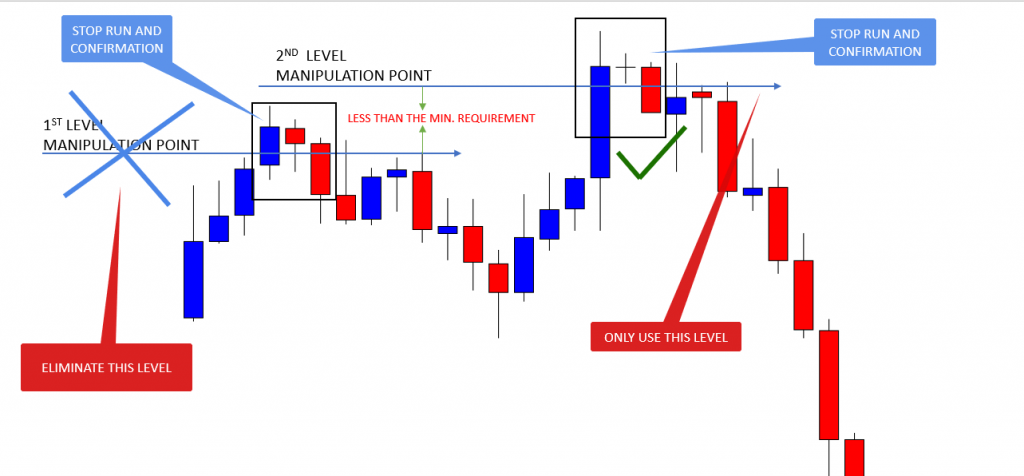
As you can see, the price creates a stop run off the first level and then makes another stop run off the higher level. We refer to this situation as a stop run on a stop run.

Just like we established earlier in the article, smart money seeks to induce buying or selling for the sole purpose of filling their positions. 

In this case, the first rejection serves as a trap as traders sell into the first resistance and then chase the price lower. As the price begins to rotate higher, these traders begin closing or stopping out of their position. As they were short, they must buy the position back. This excess buying pressure gives smart money the liquidity they need to fill their desired short position.

Once their desired position is filled during the final stop run, they rotate the price quickly to the downside for a nice profit.

• Details of deeper level selection

To avoid the risk of a stop run on a stop run, we established the rule of going to the deeper level as a good general rule of thumb.

By going to the deeper level, you immediately reduce the risk of the stop run on a stop run as you simply disregard the shallower level for the deeper

You could have a situation where price sets up on the shallower level and then goes into profit. Of course, this is always a possible outcome; however, I’m a firm believer in focusing on quality of the trade as opposed to the quantity.

• Level Separation Requirements

RULES: When selecting between multiple upper or multiple lower manipulation points, you need a minimum separation of 20% of the ADR or more. 

Additionally, you need at least 55% of the ADR separation (typically I go 55% of the ADR + 10 pips) in between the first upper manipulation point and the first lower level.

We already discussed why we want separation between multiple upper or multiple lower points, but why do we need 55% of the ADR separation between the first upper and first lower level?

The basic thought process here is that I want to be able to hit a full take profit before another clear opposing level is hit. When the proximity is under 55% of the ADR I will go with the more significant point.

Conclusion

It is vital to note that all the level selection techniques mentioned and discussed above can have a joint function.

Firstly, if you are trading the DTFL strategy, you would know whether you are trading in a trend bias or an open bias market. This would enable you to know what selection technique to use while analyzing every session.

Example:

Imagine you have a valid first push to the upside (90% of the ADR) and there are two levels within the 25-65% retracement zone. In this situation, you still must ensure that the required distance between both levels is at least 20% of the average daily range.

This combines multiple selection techniques to provide a high probability trade setup.

Thanks for reading, I hope you enjoyed it! Be sure to leave any comments or suggestions below.

Happy trading

Kevin Chima


P.S – Learn more about the DTFL Bank Trading Course, Daily Market Preview Videos, and Live room by clicking the button below.