Day Trading Forex Live – Advanced Forex Bank Trading Strategies

Getting Started with MetaTrader 4 (MT4)

MetaTrader 4 is the most commonly used platform for retail traders. It’s designed by MetaQuotes Software and it offers user-friendly tools for trading forex, futures, and contract for difference (CFD) contracts. This program can be downloaded free from any forex retail broker’s page or downloaded directly from the MT4 website.

Step by Step MetaTrader 4 (MT4) Installation Guide

 Now let’s try to install this program:

  • Download a Free MT4 Demo by Clicking Here
  • Enter your details and click “submit”
  • Scroll down and click “Download MetaTrader 4 for PC and create a demo account”
  • On the dialogue box, click “Save file”

At this point, you should have an mt4setup.exe file on your download folder. The next step is to RUN this file.

  • Double-click the exe file
  • Click next on the dialogue box below


  • Click “Finish” on completion of the installation progress in the dialogue box below

At this point, you should have the platform pop on your screen with the default settings requesting a demo account setup, as depicted in the picture below.

If it does not automatically pop up you’ll want to click File > Open an Account.

It will then ask you to select the correct server. Just look for the server address with the word ‘demo’ in it, click to select, and then hit next. 


Now let’s set up your demo account, which will allow you to refine your skills before putting live funds at risk. Market conditions stay pretty much the same as the live trading account, so you can practice using real-time price data.

Opening Your Demo Account

  • Click on File
  • Click on “Open An Account”
  • Fill in the information in the dialogue box above
  • Click “Next”
  • Record your account number and password
  • Click “Finish”

At this point, you should have a practice account with a set balance of your choice. I suggest selecting a balance close to what you intend to actually start trading with. This makes your demo experience feel as close to reality as possible.

Basic Overview of MT4

As shown above, at the top left, above the toolbars, you have the menu bar which displays the File, View, Insert, Charts, Tools, Windows and Help Menus. Understanding all the functions in these menus will give you a complete knowledge of how to use the MT4 platform.

File Menu

New Chart:

This is used to select a new currency pair chart window. As seen in the overview page, the default setting opens up just four currency pairs. If you want to trade more currencies, click on “New Chart” and click on the currency of your choice.

Open Offline:

Used to open charts in offline mode. You can select a currency pair out of the options available. The start-to-end date and the time frame are available in this option of the file menu.

Open Deleted:

Assuming you had a currency pair chart open and closed prior to your current time, this option allows you to reopen the chart with the exact costume setting you had on before closing.

Profiles:

Used to save the entire settings on the chart. Similar to templates, but in this case you can save the settings on multiple charts open at the same time.

Close:

To close an open chart box. Let’s say you have EUR/USD, GBP/USD and EUR/GBP all open at the same time and you want to close the EUR/USD. While on EUR/USD > Go to file > Click “Close.”

Save As:

This option allows you to save the historic price data of a currency pair in text format. It displays the date, time, open price, high price, low price, market close and volume of the days displayed currently on the chart. You can save this information as an excel file.

Save as Picture:

Used to capture screenshots of the charts or entire MT4 workspace.

Open Data Folder:

This folder contains all the raw files that make up the platform. It is also where new customized templates and indicators can be added to enable them to run on the chart.

Let’s look at how to install a new indicator:

  • Copy the indicator raw file
  • Click on “Open data folder”
  • Double-click on the MQL4 folder
  • Double-click on “Indicator” folder
  • Paste “Indicator”
  • Restart MT4

Open Account:

This opens a dialogue box that allows you to set up a trading account with your broker. This could be either a live or a demo account, you have to select accordingly. Some brokers redirect you to their website for this process. Remember demo trade before considering going live and ensure you use a realistic demo account size.

Login to Trade Account:

Used to log into your demo or live account. Account details include the login number, password and server information as depicted below.

MT4 Account Login

Log into MQL5. Community:

Access to this community gives you the ability to purchase MT4 or MT5 tools such as custom indicators, templates, and expert advisors.

Print Setup:

Used to set up your print format.


Print Preview:

To preview the print work.

Print:

Direct print option, used to print the chart page you are currently on, as displayed on the print preview.

Exit:

 This is used to close the MT4 program.

View Menu

This deals mostly with the display options. How and what will be displayed on the MT4 programme.

Languages:

Used to select the language you best understand. Just place the cursor on “Languages” and select your preferred language.

Toolbars:

This enables you to activate all the different toolbars. To activate, place the cursor on “Toolbars” and click on each toolbar. Below the toolbars’ functions is the Status Bar and the Chart Bar. These bars contain pivotal tools used in trading. Let’s discuss the functions of all the toolbars below.

standard toolbar

This contains the Market Watch, Data Window, Navigator, Terminal and strategy tester. It is also displayed with their shortcuts on the view menu. I’ve included the shortcut for each below as well.

Standard Toolbar

This contains the Market Watch, Data Window, Navigator, Terminal and strategy tester. It is also displayed with their shortcuts on the view menu.

  • Market Watch (CTRL+M): This displays all the different currency pairs available to the trader in the MT4 platform. To select each currency pair to trade, just right-click on the pair and select “New Chart Window.”
  • Data Window (CTRL+D): This displays the current price details of the current chart open. These details include the open/close price for the day, current volume, high, low and close price, etc.
  • Navigator (CTRL+N): This window creates access to all login details, indicators, and expert advisors right on the chart. To activate an indicator, just drag and drop on the chart.
  • Terminal (CTRL+T): On this window, you can view the current trades open, the history of open and closed trades, news releases, your mailbox,
  • Strategy Tester (CTRL+R): This is an advanced tool used to test a programmed strategy with historical

CHARTS BAR

Charts Toolbar

This contains the tools used in navigating through the charts. It includes the different types of price charts (line, candlesticks and bar chart). There will be more details on this in later chapters. It also has the zoom in and out tool, the arrange windows tool and the scroll tool, which is used to move the chart to the latest price.

Lines Studies

Lines Toolbar

This comprises of line tools used in price analysis. First, you have your “cursor” used for navigating through the entire platform.


  • The Crosshair: is used to measure price in relation to time. You can also use this tool to measure the number of pips between two price points.
  • Vertical line: for specifying the time in a chart.
  • Horizontal Line: identifying a specific price, commonly used for support and resistance zones.
  • Trend line: used to draw trend lines, diagonal channels and chart patterns that involve diagonal price movement.
  • Equidistant channel: as the name implies, it is used to draw channels that have equal distance between the top and bottom of the channel the entire length of the channel.
  • Fib Tool: used to draw Fibonacci retracement lines. We will discuss this in detail in later chapters.
  • Draw text and Label: simply just writing tools. They are mostly used for labeling.
  • Arrow: different types of arrow signs are available on this option for analysis. It’s mainly used for description purposes and can be used differently depending on the trader involved.

Time Frames

This toolbar displays all the different time frames you can set your chart to. Traders who use multiple time frames can have the same pair open in multiple time frames, all at the same time.

Customize

This tool allows you to create your own toolbar.

INSERT MENU

The insert menu is comprised of all the tools that can be inserted into a trade chart. It is important to note that using the insert menu is a long form of accessing some of these tools as they are available in the toolbar. 

For indicators, you can access them in the navigator window where all you need is a drag-and-drop process to activate any indicator of your choice.

The tools that do not have a shortcut and have not been discussed above will be explained below:

  • Trend line by angle: This is a line tool also used in diagonal price analysis but for drawing trends in specific angles or calculating the angle of a specific trend line.
  • Channels: This option contains advanced channel drawing tools used to analyze the market when the price moves in range for a select period of time.
  • Gann: These line tools are used as reversal indicators based on the idea that the market moves in a geometric pattern. Mostly based on the 45-degree angle, when placed on the chart the lines serve as support and resistance areas.
  • Shapes & Arrows: This allows you to draw on the chart for record keeping or illustration purposes.
  • Andrew’s Pitchfork: This consists of three lines that are parallel to each other. It can be used for channel analysis where the outer lines serve as possible support and resistance points.
  • Cycle lines: Used to create vertical lines with equal time distance between the lines. All you need to do is select the distance between the first two lines using the tool and it replicates it multiple times on your chart.

CHARTS MENU

The tools in this menu are mainly for formatting your chart. They are basically used to adjust what you see on the chart.

  • Indicator List: This displays all the indicators currently open on the chart and allows you to modify them to your taste.
  • Objects List: Shows all the lines, shapes and arrows on the chart. It gives you the option to adjust or delete them as well.
  • Refresh: Just like most refresh tools, this is used to refresh the chart page. It helps in times of internet freeze or data block as refreshing your chart will have all its components restart again.
  • Grid: Adds the small square boxes on the chart as displayed in the picture above.
  • Step by Step: Allows you to move the chart one price bar after the other until you get to the current price.
  • Properties: Divided into two sections, color and common. As the name indicates, you can change the color of the chart background and the bull/bear candlestick bars using the options in the color section while the common section provides the setting for price components, which include the bid and ask lines and the type of price chart (the bar chart, candlesticks, and line charts).

TOOLS MENU

The tools menu holds one of the most important functions, which is the New Order function. This allows you to enter and exit trades in whichever format you prefer.

To create a new order:

  • Click on “NEW ORDER” on the tool menu or status bar and the above dialogue box will appear
  • Select the volume, also known as lot size
  • Select the Type which consists of two options (market or pending)
  • If pending, select the exact type as displayed above (sell or buy limit and buy or sell stop)
  • Set your stop-loss and take the profit price
  • Review your parameters
  • Click “PLACE”

In the case of a market order, you can use the One Click Trading option, which is gotten by right-clicking on the chart and left-clicking One Click Trading. It will appear as shown below, from which you can just click directly to execute a market order.

WINDOWS

This menu allows you to arrange multiple currency chart windows in a specific sequence or style. See below as I have currency pairs open:

Tile Windows

Cascade

Tile Horozontal

Tile Verticle

HOW TO INSTALL A CUSTOM INDICATOR

  • Get and copy the custom indicator file (downloaded or copied from a good friend’s hard drive). The icon is usually as displayed below:
  • Go to File Menu
  • Click on “Open Data Folder”
  • Double-click to open the MQL4 folder
  • Double-click to open the “indicators” folder
  • Copy and Past or Drag and Drop the custom indicator into this folder
  • Now restart your MT4 platform your indicator should be listed in the navigator window.
Navigator MT4

HOW TO INSTALL A CUSTOM TEMPLATE

A template is comprised of a bunch of indicators all working together in a particular format. So to install a template would mean installing a set of indicators and then the template file that allows the several indicators to be set up at once.

  • Copy all the indicator files
  • Go to file menu
  • Click on “Open Data File”
  • Double Click the ‘MQL4’ folder
  • Double Click the ‘Indicator’ folder and paste all the indicators there
  • Go back to the Open Data File folder
  • Open the ‘Templates’ folder
  • Paste the Template file and exit the folder
  • Restart MT4 and you should have all the indicators installed showing in the example section of the navigator window

Now to apply the new template:

  • Click ‘Charts’ in your MT4 platform or right-click on the price chart
  • Then go to Templates
  • Click on the installed template

HOW TO INSTALL AN EXPERT ADVISOR (EA)

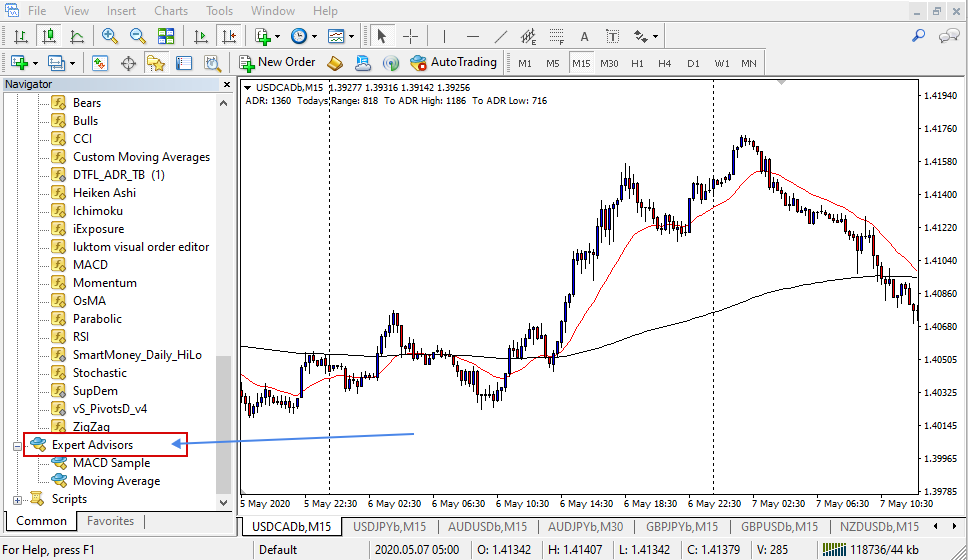
An Expert Advisor otherwise known as an EA is a software that runs on the MT4 platform and performs a sequence of trading commands as programmed. Basically, it allows the trader to enter and manage trades automatically without actively placing the trades nor managing them.

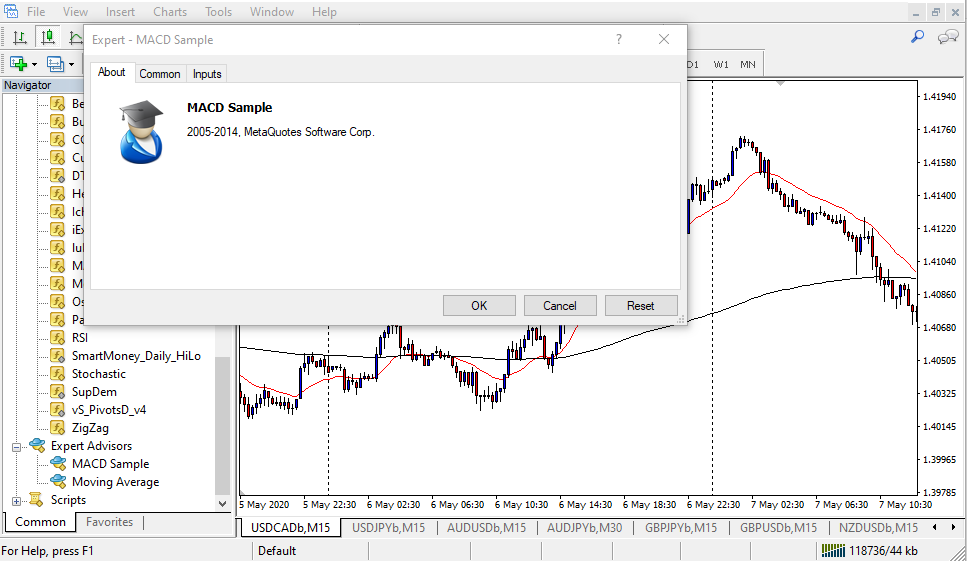
It is very important that you study an EA closely before trading with it especially when going to a live as it will be trading while you’re not there.

Also, and 99.999%  of the time, the results are false. I’ve been trading for 16+ years and I’ve never seen an EA maintain a consistent profit for months, let alone years.

If trading were that easy everyone would do it. Don’t get fooled into thinking you can do this without putting in the work.

That said, there are many useful EA’s that can assist in trade management and other functions to assist the trader.

  • Copy the EA raw file
  • Save in a specific location
  • Go to file menu
  • Click on “Open Data File”
  • Double Click the ‘MQL4’ folder
  • Open the Expert Folder
  • Paste the EA raw file
  • In the Navigator window search for “Expert Advisors” and double-click on it and all the EAs should appear
  • Select the EA you just installed and drag to the price chart
  • A dialog box should display with the settings; here you can adjust the features of the EA
  • Click “OK” and you are auto trading
Forex Trading Course - Day Trading Forex Live
DTFL Pro